[ad_1]
Confidence in the property sector hit its highest point since 2018, with industry gearing up for a strong economic recovery as we welcome in the new year.
Confidence in the property sector hit its highest point since 2018, with industry gearing up for a strong economic recovery as we welcome in the new year. The Index rose 12 points nationally in the December quarter off the back of substantial confidence boosts in the ACT & Victoria specifically as the jurisdictions reopened.
“The sentiment in this survey is clear: The property industry – which employs more Australians than any other sector – is set and ready for recovery,” Property Council Chief Executive, Ken Morrison, said.
“Despite the Reserve Bank of Australia’s (RBA) indications of static interest rates, our members expect they will rise over the next 12 months, and in turn, expectations for continued house price growth have eased,” he added.
The Australian housing market has been a star performer on the global stage since the pandemic broke. The gap between housing price increases and disposable income growth accelerated to 24.6% in Q3 of 2021 with the national vacancy rate falling to 1.6% in October, the lowest level since 2011. Population growth however has fallen due to tight border controls essentially eliminating immigration.
In his final address as REIA President Mr Kelly said he had hoped market conditions in 2022 would stabilise.
“I’m hopeful that 2022 will see a more normal supply of properties coming to market which will start to ease the affordability issues currently being experienced by first home buyers.
“The key indicators we are looking at will be listings coming onto the market, home loan and rent to income ratios, interest rates, jobs and unemployment, inflation and immigration,” Mr Kelly said.
Mr Kelly exited his post as President in last 2021, with Hayden Groves stepping in as REIA’s new president. Mr Groves, who joined the REIA Board in 2015, succeeds Adrian Kelly who served as REIA President from 2018 – 2021.
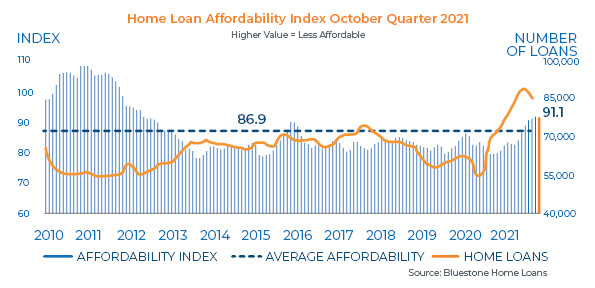
Bluestone Home Loans released their Home Loan Affordability Index for the October quarter late in December 2021 revealing the steep decline in affordability had steadied and started to fall. National affordability improved by 0.4% however had fallen sharply 14.3% over the past 12 months as a result of booming house prices and increasing the average loan size for buyers.
The Index was 91.1 in the October quarter, still above the long term average of 86.9. Index levels above the long-term average indicate the clear prospect of continuing easing of house price growth and declining home loans.
Dr Andrew Wilson, consultant economist for Bluestone Home Loans commented: “Although the easing of recent severe Covid-19 lockdown restrictions reactivated impeded home buyers, the cyclical cooling of housing markets, particularly in Sydney and Melbourne will likely result in lower home lending activity overall – and well below the levels at the peak of the home loan boom earlier in 2021.
“Short-term sharp shifts in migration have implications for housing markets with significant changes in demand impacting rents and prices. Opening borders and a rapid reintroduction of mass international migration (notwithstanding further Covid-19 outbreaks) will however provide a significant demand source that will act to reinvigorate housing markets generally over the medium-term.”
The National Housing Finance and Investment Corporation (NHFIC) also released their analysis late in 2021 with key findings including:
- First Home Buyers in regional SA, WA and QLD continued to experience better affordability outcomes compared to major cities, but worsened for regional NSW and Tasmania with the bottom 40% of income earners affording up to 10% of homes for sale.
- Sydney and Melbourne saw improvements in rental affordability due to a decrease in migration drawing rents down.
- Melbourne was the most affordable capital city for renters, and Perth was the most affordable for potential first home buyers. The bottom 40% of Melbourne income earners can afford up to 30% of properties available for rent, and the bottom 60% of Perth income earners can afford up to 50% of properties for sale.
Eliza Owen, Head of Research at Corelogic reflected on each State’s performance for 2021 below, and despite the 2021 ‘boom’ house prices in almost all (6 of the 8) capital cities have been ‘undervalued’ based on local average household’s ability to repay home loans according to InvestorKit’s lasted report. In a sign of potential positivity towards housing affordability these capital cities have been deemed affordable markets where data analysed affordability through home loan serviceability.
It calculated the percentage difference between the current median house price and the ‘affordable house price’ across each capital city to determine whether a market was unaffordable or ‘overvalued’, or deemed affordable or ‘undervalued’ – that is, if prices are higher or lower than the average household can afford.
“Our analysis shows that most of Australia’s capital cities are still affordable for Australians. However, cash rate hikes would affect housing affordability to a large extent, particularly in the ACT, where a one per cent rate rise would see house prices shift from affordable to unaffordable.
“Fortunately, the RBA recently indicated that there would not be a cash rate increase in 2022 – good news for homebuyers planning to enter the market.” Said Arjun Paliwal, Head of Research at InvestorKit.
The findings for each capital city from InvestorKit’s research is detailed below.
NSW
The NSW property market has been in upswing since October 2020, with state-wide dwelling values increasing 26.5% in the 12 months to November 2021. This is the second-highest uplift of the states and territories (behind Tasmania, where dwelling values increased 28.6%).
The highest annual growth rates have occurred in premium lifestyle markets including the Southern Highlands and Shoalhaven (36.6%), Sydney’s Northern Beaches (36.4%), the Central Coast (34.1%) and Sydney’s Baulkham Hills and Hawkesbury region (33.2%).
Sydney
Sydney house prices are the most overvalued across the country. With the median house price now $1.11 million and the affordable median price at 3.5 per cent interest being $862,000, the Sydney property market is overvalued by 22.3 per cent – meaning that house prices are 22.3 per cent higher than the average household can afford.
If home loan interest rates were to increase one per cent, to 4.5 per cent, the market will exceed the affordable level by nearly a third (31.2 per cent).
VIC
Victoria has seen the greatest divide in dwelling market performance between its regional and metropolitan areas. Greater Melbourne dwelling values have increased 16.3% in the 12 months to November 2021 (second-weakest result of the capital cities), while regional Victorian dwelling values were 24.0% higher over the year.
Australia’s international migration restrictions and Melbourne’s extended lockdowns in both 2020 and 2021 were the two major headwinds to have impacted the city’s migration levels, economic output and housing demand across the city.
Melbourne
The median house price in Melbourne ($818,000) has just exceeded the affordability level by 2.8 per cent at a 3.5 per cent interest rate. If the interest rate were to rise to 4.5 per cent, the market would be overvalued by 13.9 per cent, with the maximum affordable house price for an average dual-income household being $795,000.
Analysing market pressure, it is high on the sales side – indicating short-term capital growth. However, with sales listings increasing, price growth will slow ahead.
QLD
The Queensland housing market has seen highly diverse property performance outcomes. Lifestyle markets in the state’s South East have shown the highest rate of growth in the past year, while Brisbane (and Adelaide) had a rolling quarterly growth rate that continues to trend higher.
This can be attributed to several factors including historically low listings and a median house value of $757,194, which is -23.3% less than Melbourne’s median house value and -44.3% less than Sydney’s median house value. Queensland also recorded Australia’s highest net interstate migration figure in the year to March 2021, with interstate migration increasing 28.2% over the year.
Brisbane
Brisbane’s median house price is $603,000 – 29.6 per cent lower than the affordable median price at 3.5 per cent interest rate; therefore, it is an undervalued market. If interest rates increased one per cent, Brisbane would still be undervalued, at 14.8 per cent. Being much more affordable than the two biggest cities, Brisbane and southeast Queensland are quickly gaining popularity, evident by interstate migration numbers.
Brisbane’s market pressure is easing for both sales and rental markets, however, are still at high levels, hence a strong 2022 is likely.
SA
The quarterly growth in dwelling values across Adelaide was 6.5% as of November 2021, the second highest of the capital city dwelling markets and its highest quarterly growth rate for the past 20 years.
The Adelaide housing market has seen sustained, high levels of quarterly growth in part attributable to persistently low levels of housing supply and relative affordability. Adelaide’s median dwelling value of $558,179 makes it the third most affordable city behind Perth and Darwin.
Adelaide
Adelaide’s median house price ($526,600) is significantly lower than the affordability threshold by 42.8 per cent, and by 26.5 per cent if the home loan interest rate increased by one per cent. The sales market pressure in Adelaide is much higher than a year ago and continues to get stronger.
Rental market pressure is also strong in Adelaide as vacancy rates remain well below two per cent. Investors can expect a healthy-level yield of at least 4 per cent.
WA
Western Australia’s dwelling values have been increasing since November 2019, placing them 22.1% higher than when they bottomed out in October 2019, yet still -3.4% below the record high of June 2014.
The recovery in WA dwelling values has been more robust across Perth, where values are -2.4% below the June 2014 record, while dwelling values across regional WA remain -20.7% below their peak of January 2008. The upward trend in property prices has followed several cash rate reductions, more positive trends in internal migration, and an uptick in employment, particularly across the mining sector.
Perth
Perth house prices are the most undervalued across the capital cities. The median house price ($510,000) is 63 per cent cheaper than the maximum price a local household can afford, and 44.7 per cent lower if interest rates rose by one per cent.
“The large gap in housing affordability is due to Perth’s high personal income level and the low median house price – the lowest among capital cities.” Mr Paliwal said.
Market pressure in Perth is high – sales volumes have stabilised and sales listings are also stabilising, which will slow growth rates for 2022.
However, with Perth still experiencing high pressure and a low 10-year price growth of nine per cent, there may still be opportunity for growth. Rental vacancy rates remain at very low rates (at 0.6 per cent), indicating a tight rental market. Therefore, investors can expect a healthy-level yield of more than four per cent.
TAS
Tasmanian dwellings continued to dominate growth performance across the states and territories through to November, with dwelling values rising almost 30% in the past 12 months, taking the state’s five-year annualised growth rate to 11.8% per annum.
Hobart’s median dwelling value has gone from the lowest of all capital cities at $359,088 to the fourth highest of the capital cities at $676,595 in the past five years. Over the same period median rent values have risen from $345 per week to $495 on the back of a robust economic and demographic position in the lead up to the pandemic.
Hobart
Hobart’s median house price ($595,000) is undervalued by 18.3 per cent at 3.5 per cent interest. If interest rates increased one per cent, median house prices would be five per cent lower than the affordability threshold.
Although house prices aren’t high to many buyers from the mainland, Hobart has the lowest average personal income among the capital cities, making the city lose its affordability for the locals if lending rates are raised.
Sales market pressure is extremely high, with listings slowly rising while sales volumes decline slightly. This could keep a strong 10-year performance, with house prices having grown 77 per cent over 10 years.
NT
Low interest rates, first home buyer incentives, government assistance packages through COVID-19 and improving economic conditions have supported dwelling values across the NT, which increased 15.6% in the 12 months to November.
Strict border restrictions since the onset of COVID-19 partially stemmed the flow of people away from the Territory and despite Darwin dwelling values rising 25.9% since bottoming out in March 2020, the latest home value index results show Darwin’s dwelling values remain -15.3% below the peak in May 2014.
Darwin
Darwin’s median house price, at $550,000, is 61.3 per cent lower than the affordability level, and by 42.8 per cent if interest rates rose to 4.5 per cent. Arjun says the large percentage difference is due to Darwin’s high personal income level (highest among capital cities) and the relatively low house prices.
Darwin’s sales market is the highest in a decade.
“The sales market is so active that both listings and sales volume are increasing steadily,” said Mr Paliwal.
“Many are trying to use this booming time to get out, in our opinion, as listings don’t rise at this rate when boom conditions typically occur.”
ACT
The ACT’s housing market has surged consistently throughout 2021 with median house value across the nation’s capital $245 short of reaching $1 million in November, having increased 27.2% in the past 12 months. The ACT overtook Melbourne’s median house value in October 2021 and is second only behind Sydney.
Despite the sustained growth, Canberra’s housing affordability has held up relatively well due to higher than average wages and low unemployment rates.
Canberra
With the median house price in the ACT at $826,000, it is 6.6 per cent lower than the affordability threshold, which deems it an undervalued market. However, if interest rates hiked one per cent, houses would become overvalued by 5.6 per cent – that is, 5.6 per cent higher than the average dual-income household could afford.
Market pressure in Canberra is extremely high in both sales and rental markets, as it remained a very resilient market and local economy during the pandemic. Now, there are signs of a supply crisis as monthly sales volumes have exceeded the number of listings since early 2021. Although sales volumes are slowing, a low number of listings (less than 450 in September) indicates another healthy 2022 ahead.
[ad_2]
Source link