[ad_1]
Please use the menu below to navigate to any article section:
Our rental markets are on the move.
CoreLogic’s recently released Quarterly Rental Review shows the national rental index increased 1% over the month of March and 2.6% over the March quarter.
Continuing the trend seen since the onset of the pandemic, regional dwelling rents outpaced growth in capital city dwelling rents over the quarter, with regional rents rising 2.9% compared with a 2.5% rise across the capitals.
Compared to the December quarter, the pace of growth increased across both markets, up 80 and 40 basis points for the combined capitals and combined regionals respectively.
In contrast and bucking the trend seen since May 2019, national unit rents rose at a faster pace than national house rents, at 3.0% and 2.4% respectively, with both segments also seeing an increase in the pace of quarterly rental growth.
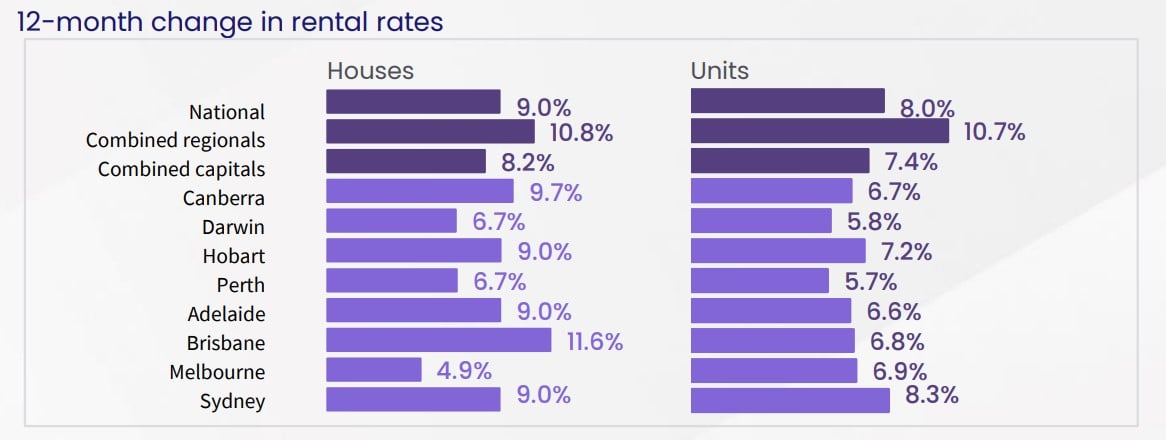
Despite the recent surge in unit rents, houses (9.0%) are still outperforming units (8.0%) in the annual trend.
Similar to the national results, the combined capitals unit rents outperformed house rents over the first quarter, increasing 3.1% compared to a 2.2% rise in house rents.
The pace of capital city rental growth has accelerated compared to the previous quarter, up 30 basis points for houses and two percentage points for units.
This has seen the annual performance gap between capital city houses and units fall to the smallest gap since the onset of COVID, at just 80 basis points.
 It’s interesting to see that as the national pace of capital growth falls, the rental market has re-accelerated.
Much of this momentum could be stemming from a recovery in Melbourne rent values, which saw a peak-to-trough decline of -4.0% between March and December of 2020, but have since recovered to pre-COVID levels and hit new record highs.
The only market which has not yet quite recovered full value since the onset of COVID is the Inner Melbourne market, but it is well on its way.
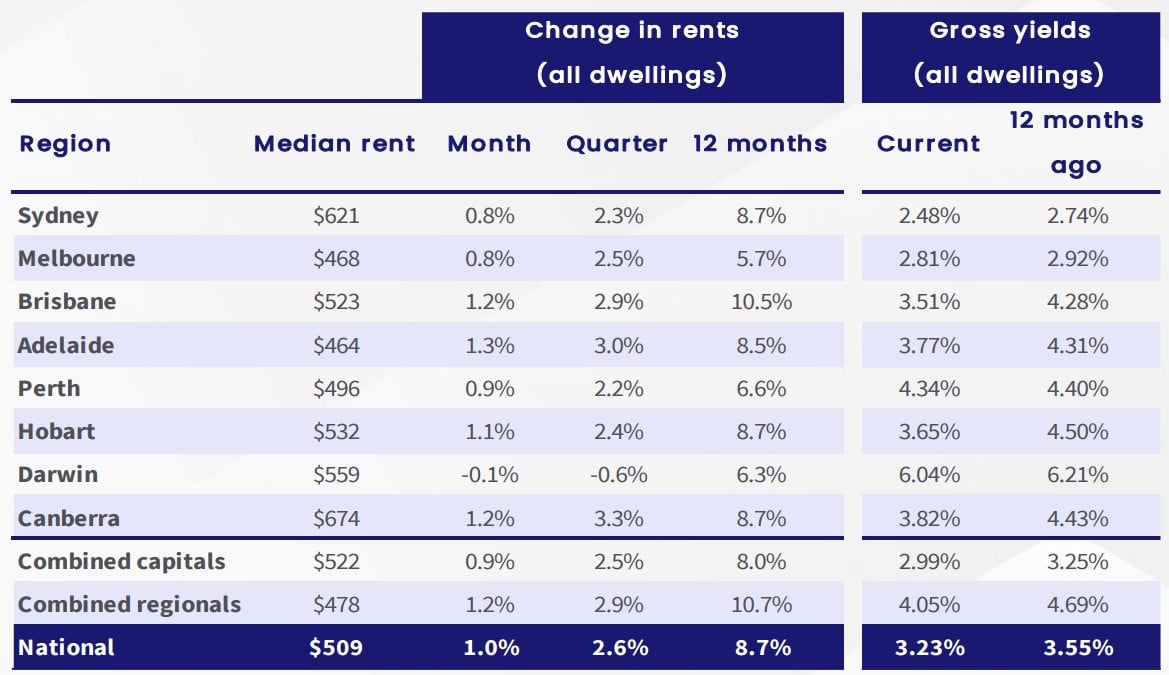
Canberra recorded both the highest median rental value ($674 p/w) and strongest quarterly rental growth (3.3%) amongst capital city dwellings, the equivalent to an average rental rise of $21 per week.
Adelaide recorded the second strongest rental performance, up 3.0% over the quarter, followed by Brisbane (2.9%) and Melbourne (2.5%).
At the other end of the spectrum, Darwin recorded a -0.6% decrease in dwelling rents over the quarter, equivalent to a $3 fall in median dwelling rents.
 There is a noteworthy reversal of quarterly growth trends occurring across the capital cities.
Melbourne rent values have now seen a rise in quarterly growth for four consecutive quarters.
Meanwhile, rent markets that saw high demand earlier in the cycle, such as Perth and Darwin, have been consistently easing.
Recent momentum in the Melbourne rental market coincides with eased travel restrictions for overseas arrivals, which is likely aiding the recovery in this market.
Additionally, eased social distancing and increased rates of vaccination will also aid return to office strategies, which may flow through to more rental demand in inner Melbourne markets.
Adelaide remained the cheapest capital city for renters, with the typical dwelling renting for $464 per week, followed by Melbourne ($468 p/w) and Perth ($496 p/w).
Comparing the most and least expensive markets, the typical Canberra dwelling is renting for approximately $210 p/w more than the typical rental dwelling in Adelaide.
Rental yields
 With rental growth (2.6%) outperforming value growth (2.4%) over the three months to March, national dwelling yields have recorded a one basis point rise since December (3.22%) and two basis points since reaching a new record low of 3.21% in January and February.
Despite the recent rise, national rental yields are still 32 basis points below the yield recorded this time last year (3.55%).
Compared to the previous quarter, movements in yields are varied, reflecting the diversity in home values.
Yields rose across Sydney, Melbourne and Canberra, and fell across Brisbane, Adelaide, Perth, Hobart and Darwin.
Brisbane (3.51%) recorded the largest fall in rental yields over the quarter, while Darwin (6.04%) continues to record the highest rental yield amongst the capitals, followed by Perth (4.34%) and Canberra (3.82%).
At the other end of the spectrum, the Sydney (2.48%) and Melbourne (2.81%) markets, which saw a sharp decline in rental demand throughout the COVID period recorded the lowest yields, despite a small rise over the quarter.
Perth recorded the smallest year on year change in yields, down just six basis points (from 4.40% to 4.34%) following annual value growth of 10.6% and annual rental growth of 6.6%.
This was followed by Melbourne and Darwin, with these markets recording an 11 and 17 basis point fall in dwelling yields respectively.
Hobart recorded the largest reduction in yields, from 4.50% in March 2021 to 3.65% in March 2022.
For the first time since August 2020, gross rental yields have also increased, albeit by one basis point between February and March.
This trend is expected to continue as rent values increase faster than purchase prices.
Eased international travel restrictions are likely to be a catalyst for continued growth in the rental market, as overseas arrivals such as international students and long term migrants are typically renters when they first come to Australia.
Most expensive and most affordable suburbs
 CoreLogic’s quarterly Rental Review includes a list of the top 30 most expensive and affordable rental suburbs for each capital city as well as all key rent and yield statistics.
Vaucluse in Sydney’s eastern suburbs remained Australia’s most expensive suburb for house rentals, with a median weekly rental value of $2,394.
This is almost double the next highest median house rent in Melbourne’s Brighton ($1,281).
Elizabeth North in Adelaide was the most affordable suburb to rent a house at $326 per week.
For units, Sydney’s Point Piper, also in the city’s eastern suburbs, remained the most expensive rent at $1,096 per week compared to Orelia in southern Perth which has the country’s most affordable median rental value for units at $268 per week.
National rental index rises 2.6% over the March quarter
 The pace of rental growth increased over the first quarter of 2022 with the national rental index recording a 2.6% quarterly rise.
This was comprised of a 0.8% rise in January and February and a 1% rise in March.
The March result is down 60 basis points from the peak rate of quarterly growth recorded over the three months to March 2021 (3.2%), however, it is 70 basis points up from the 1.9% rental growth recorded over the December quarter, suggesting the rental market is seeing some re-acceleration in growth.
With the peak quarterly growth now falling out of the annual growth calculation, the annual pace of growth fell from its peak rate (9.44%) recorded over the year to November, to 8.7% over the 12 months to March.
Continuing the trend seen since the onset of the pandemic (March 2020), regional rental growth outpaced growth in capital city rents over the first quarter, with regional rents rising 2.9% compared with a 2.5% rise across the capitals.
Compared to the December quarter, the pace of growth increased across both markets, up 80 and 40 basis points for the combined capitals and combined regionals respectively.
Despite this, the annual growth trend weakened over the quarter for both the combined capitals and the combined regional market.
The combined capitals recorded an annual rental rise of 8.0% over the 12 months to March, down from a peak rate of 8.4% in December, while the combined regional’s annual growth rate fell from 12.5% in November to 10.7% over the 12 months to March.
Canberra recorded both the highest median rental value ($674 p/w) and strongest quarterly rental growth (3.3%) amongst capital city dwellings, recording an average rental rise of equivalent to $21 per week.
Adelaide recorded the second strongest rental performance, recording a 3.0% rise over the three months to March, up from the 1.3% rise recorded over the December quarter, followed by Brisbane (2.9%) and Melbourne (2.5%).
At the other end of the spectrum, Darwin recorded a -0.6% decrease in dwelling rents over the quarter, equivalent to a $3 fall in median dwelling rents.
A noteworthy reversal of quarterly growth trends is occurring across the capital cities.
 Melbourne rent values have now seen a rise in quarterly growth for four consecutive quarters.
Meanwhile, rent markets that saw high demand earlier in the cycle, such as Perth and Darwin, have been consistently easing.
Recent momentum in the Melbourne rental market coincides with eased travel restrictions for overseas arrivals, which is likely aiding the recovery in this market.
Additionally, eased social distancing and increased rates of vaccination will also aid return to office strategies, which may flow through to more rental demand in inner Melbourne markets.
Adelaide remained the cheapest capital city for renters, with the typical dwelling renting for $464 per week, followed by Melbourne ($468 p/w) and Perth ($496 p/w).
Comparing the most and least expensive markets, the typical Canberra dwelling is renting for approximately $210 p/w more than the typical rental dwelling in Adelaide.
Houses vs Units

Bucking the trend seen since May 2019, national unit rents rose at a faster pace than national house rents over the first three months of the year, recording a quarterly growth of 3.0% compared to 2.4% for houses.
 Compared to the final quarter of last year, both segments saw an increase in the pace of quarterly rental growth, up from 2.1% and 1.3% for houses and units respectively.
Despite the recent surge in unit rents, houses (9.0%) are still outperforming units (8.0%) in the annual trend.
Similar to the national results, the combined capitals unit rents outperformed house rents over the first quarter, increasing 3.1% compared to a 2.2% rise in house rents.
The pace of capital city rental growth has accelerated compared to the previous quarter, up 30 basis points for houses and two percentage points for units.
This has seen the annual performance gap between capital city houses and units fall to the smallest gap since the onset of COVID, at just 80 basis points.
Across the individual capital cities, all market segments recorded a rise in rents over the latest quarter, with the exception of Darwin units, which recorded a -1.8% rent reduction.
 Melbourne unit rents recorded the strongest quarterly rental growth rate in March (3.9%), more than double the rental rise recorded in the December quarter (1.6%), while Canberra recorded the strongest rise in house rents (3.5%).
After recording strong rental growth in the first half of last year, Darwin is now recording the weakest rental performance across both segments, with the annual rate of rental growth for Darwin houses falling from a peak rate of 23.6% in June to an annual growth rate of just 6.7% over the 12 months to March.
Across the combined regionals, both houses and units recorded a softening in the annual rental growth trend, despite quarterly growth strengthening.
Regional house rents (which were up 2.9% in the quarter) continued to outperform regional unit rents (which rose 2.8%), albeit by only a 10 basis point gap in quarterly rental growth.
 Canberra maintains its position as the most expensive rental market across both property types, with the typical rental house costing $743 per week, and the typical unit renting for $560 per week, while Sydney came in as the second ($687 p/w for houses and $546 p/w for units).
Similarly, Adelaide remained the most affordable capital across both segments, at $485 per week for houses and $384 per week for units.
Melbourne came in second for houses at $498 per week, while Perth was the second most affordable unit market ($437).
The dollar gap between the most and least affordable capital cities grew, from a house rental gap of $247 in December to a $258 gap in March, while the gap in unit rents grew from $168 to $176 over the same period.

[ad_2]
Source link