[ad_1]
The ABS this week released their building activity data for September 2021 quarter, showing estimates of the value of building work, number of dwellings commenced, completed, under construction and in the pipeline across Australia.
The ABS this week released their building activity data for September 2021 quarter, showing estimates of the value of building work, number of dwellings commenced, completed, under construction and in the pipeline across Australia.
“More detached homes commenced construction in the 12 months to September 2021 than in any previous period,” stated HIA Economist, Tom Devitt.
ABS’s monthly building approval data showed detached homes in November 2021 increased by 3.6% on previous quarter and were the strongest they’ve been since February 2000 excluding the HomeBuilder surge in 2020/21.
“Detached approvals remain elevated in all jurisdictions, this boom in detached home building is set to be sustained well into 2023.,” stated HIA’s Chief Economist, Tim Reardon.
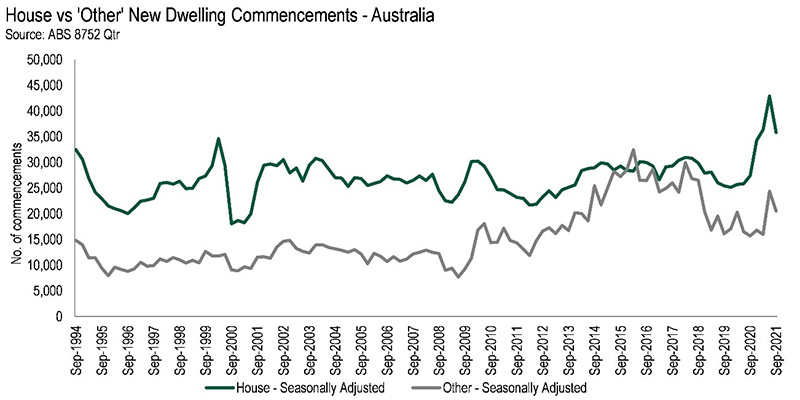
With almost 36 000 house starts for the quarter, well above any quarter before the mid 2020 HomeBuilder grant introduction, it contributes to 149 345 starts for the 12 month cycle; a new record 12.8% above the pre-HomeBuilder record of 132 377 in 1988/89.
All states and territories saw declines in the September 2021 quarter in new house commencements, led by the Northern Territory (-65.5 per cent), Western Australia (-28.0 per cent), Queensland (-24.6 per cent), Tasmania (-24.2 per cent), the Australian Capital Territory (-11.9 per cent), and New South Wales (-11.3 per cent), Victoria (-11.0 per cent) and South Australia (-8.6 per cent).
“Lockdowns in Sydney and Melbourne resulted in a sharp contraction in new detached home starts in the September quarter, with a 16.5 per cent contraction compared to the record high of the previous quarter.
“The decline in new home commencements in the September quarter was not a reflection of a slowing market, with other indicators, such as building approvals, showing a continued strong pipeline,” added Mr Devitt.
Coupled with this, there were 20 500 new multi-unit starts for the quarter, down 15.8% on the previous quarter but up 11.7% for the year.
A few states saw increases in multi-unit commencements in the quarter, led by Tasmania (+240.4 per cent), Western Australia (+37.2 per cent) and Victoria (+17.0 per cent). The other jurisdictions saw declines, led by the Northern Territory (-46.7 per cent), the Australian Capital Territory (-42.4 per cent), Queensland (-35.2 per cent), South Australia (-33.4 per cent) and New South Wales (-32.6 per cent).
“Multi-unit approvals have been recovering from the adverse impact of COVID-19 and continued to increase in November with a 7.5 per cent increase in the month. This leaves multi-unit approvals for the three months to November also 7.5 per cent higher than for the same period the previous year.
“This is an encouraging sign that apartment construction will return prior to the return of overseas migration. Said Mr Readon.
“The current boom is expected to continue supporting strong levels of employment into 2023, aided further by record low interest rates and the pandemic pushing households towards lower density living.
“Strong employment conditions, rising house prices and consumer confidence are also continuing to support housing demand.” addeded Mr Devitt.
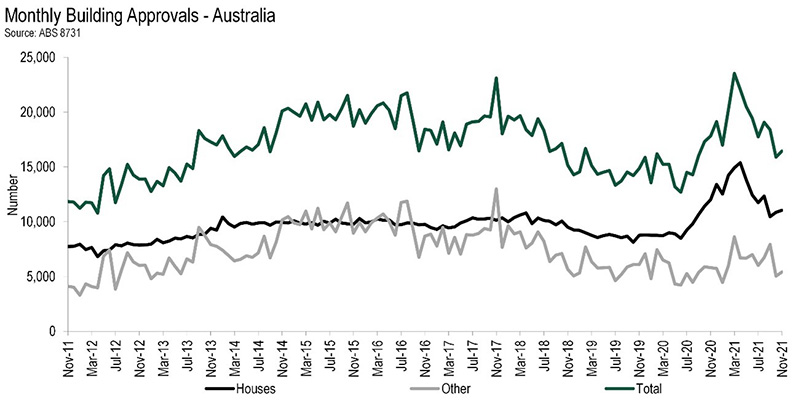
In seasonally adjusted terms, total residential building approvals increased in November 2021 compared to the previous month in most states. Tasmania led the pack (+40.8 per cent), Queensland (+20.0 per cent), followed by South Australia (+14.5 per cent) and Victoria (+8.9 per cent). New South Wales had the largest decline (-18.4 per cent) reflecting volatility in the multi-unit approvals, Western Australia also declined marginally (-1.1 per cent). In original terms, building approvals increased in the Australian Capital Territory (+18.9 per cent) and the Northern Territory (86.4 per cent).
“The value of renovations approved also remains elevated. The last 12 months has seen the value of renovations approved increase by 35.7 per cent on the previous year.
“All indications continue to demonstrate that demand for building services and materials will remain elevated in all regions throughout 2022 and well into 2023,” added Mr Reardon.
“The boom in renovations also looks set to continue with lending for renovations up by 91.4 per cent in the 12 months to November compared to the previous 12 months,” concluded Mr Ward.
November data for lending to Households and businesses was also released by ABS this week, showing loan values (excluding refinancing) had also increased further demonstrating strong demand.
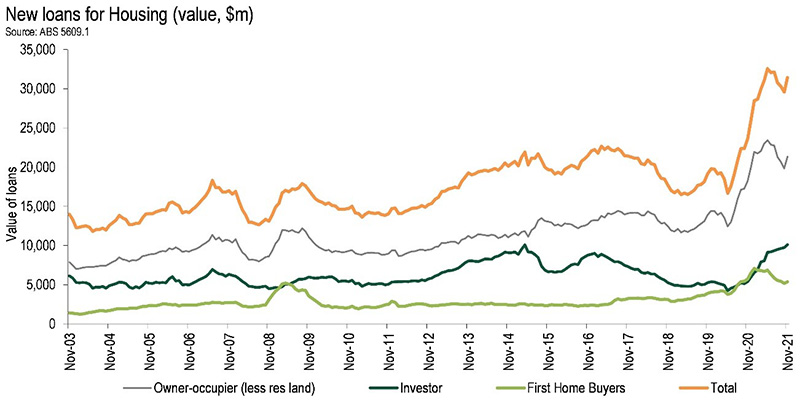
The total value of new loans increased for the first time in four months, rising by 6.3% to reach $31.44 billion in November, which is the largest increase seen since January 2021. The total value of new loans is also up 33.2% from a year ago.
“The value of loans to owner occupiers increased by 7.6 per cent in the month of November. This leaves the value of loans to owner occupiers 46.0 per cent higher in the 12 months to November 2021 compared to the previous 12 months,” stated HIA Senior Economist, Nick Ward.
“The number of loans to first home buyers increased in November and accounted for 34 per cent of owner occupier loans. This remains above the average of the past decade, “The number of loans issued to owner-occupiers to construct a new dwelling was up 48.3 per cent in the 12 months to November 2021, compared to the previous 12 months, and “The value of loans to investors were 69.5 per cent higher in the 12 months to November 2021, compared to the previous 12 months, as investors respond to the very tight rental markets around the country,” continued Mr Ward.
Investors remained undeterred by the competition with new investment lending increasing for the 13th consecutive month, rising by 3.8% from the month prior to reach $4.6 billion in November. New investor lending also remains up a whopping 86.9% from a year ago.”
“As if the housing market wasn’t already hot enough, November is the first time in four months that new lending increased.” Said Steve Mickenbecker Group Executive Financial Services, Canstar.
“Even first home buyers jumped back into the market, up 3.7 percent for the month but still down 6 percent on November twelve months ago. It’s a long way back for this group when facing competition from investors who are borrowing 87 percent more than a year ago.
“With Canstar listing 119 loans with interest rates below 2 percent, it is a bit surprising that refinancing has slowed in November. Rates are likely to be higher at the end of 2022, and now is still a great time to be jumping into a low rate and get ahead before the inevitable increase.” Mr Mickenbecker concluded.
ABS Lending Indicators
| Nov-2020 | Oct-2021 | Nov-2021 | Difference | % Change | |||
|---|---|---|---|---|---|---|---|
| MoM | YoY | MoM | YoY | ||||
| Value of new housing commitments | |||||||
| Total Housing | $23.61 billion | $29.57 billion | $31.44 billion | $1.87 billion | $7.83 billion | 6.3% | 33.2% |
| Owner Occupied | $18.20 billion | $19.84 billion | $21.34 billion | $1.50 billion | $3.13 billion | 7.6% | 17.2% |
| Investment | $5.40 billion | $9.73 billion | $10.10 billion | $369.5 million | $4.70 billion | 3.8% | 86.9% |
| Value of refinancing to a new lender | |||||||
| Total | $10.14 billion | $16.08 billion | $15.72 billion | -$363.3 million | $5.58 billion | -2.3% | 55.1% |
| Owner Occupied | $6.25 billion | $10.26 billion | $10.04 billion | -$218.9 million | $3.78 billion | -2.1% | 60.5% |
| Investment | $3.88 billion | $5.83 billion | $5.68 billion | -$144.4 million | $1.80 billion | -2.5% | 46.3% |
| Value and number of new construction lending for owner occupiers | |||||||
| Value | $3.04 billion | $2.16 billion | $2.34 billion | $177.3 million | -$706.2 million | 8.2% | -23.2% |
| Number | 7,177 | 4,456 | 4,703 | 247 | -2,474 | 5.5% | -34.5% |
| Value and number of new lending for owner occupier first home buyers | |||||||
| Value | $5.73 billion | $5.19 billion | $5.38 billion | $193.8 million | -$346.2 million | 3.7% | -6.0% |
| Number | 14,064 | 11,402 | 11,622 | 220 | -2,442 | 1.9% | -17.4% |
Source: www.canstar.com.au. Based on ABS Lending Indicators, Nov-2021, seasonally adjusted figures.
New lending (Number – Original, Value – Seasonally Adjusted)
| Nov-19 | Nov-20 | Nov-2021 | |
|---|---|---|---|
| Total (owner occupier + investor) | |||
| Number | 46,028 | 54,750 | 65,834 |
| Value | $19.17 billion | $23.61 billion | $31.44 billion |
| YoY % Change in Value | – | 23.2% | 33.2% |
| Owner Occupiers | |||
| Number | 33,335 | 42,576 | 44,674 |
| Value | $13.91 billion | $18.20 billion | $21.34 billion |
| YoY % Change in Value | – | 30.8% | 17.2% |
| Upgraders (Owner Occupiers excl FHBs) | |||
| Number | 23,886 | 28,512 | 33,052 |
| Value | $10.01 billion | $12.47 billion | $15.96 billion |
| YoY % Change in Value | – | 24.6% | 27.9% |
| First Home Buyers | |||
| Number* | 9,449 | 14,064 | 11,622 |
| Value | $3.90 billion | $5.73 billion | $5.38 billion |
| YoY % Change in Value | – | 46.7% | -6.0% |
| Investors | |||
| Number | 12,693 | 12,174 | 21,160 |
| Value | $5.26 billion | $5.40 billion | $10.10 billion |
| YoY % Change in Value | – | 2.8% | 86.9% |
| External Refinancers (owner occupier + investor) | |||
| Number | 22,439 | 22,379 | 33,337 |
| Value | $10.01 billion | $10.14 billion | $15.72 billion |
| YoY % Change in Value | – | 1.2% | 55.1% |
Source: www.canstar.com.au. Based on ABS Lending Indicators, Nov-2021, original figures for numbers and seasonally adjusted figures for values. *FHB Number based on seasonally adjusted figures.
“The constraint on home building is not demand but the availability of land, labour and materials. The shortage of labour and materials has led to construction timeframes increasing significantly.
“Under normal circumstances, the surge of HomeBuilder projects would have translated into an increase in completions from the June 2021 quarter. However, completions have been slower to respond. As a result, the volume of approved-but-not-yet-commenced work is at its highest level in over a decade,” concluded Mr Devitt.
[ad_2]
Source link