[ad_1]
Please use the menu below to navigate to any article section:
With property prices at record highs and wages growth struggling to keep up, housing affordability has become worse than ever, with warnings of ‘mortgage stress’ on the horizon amid an impending cash rate increase.
 Over the past decade, Domain data shows that house prices across Australia’s combined capitals increased by 101%, and unit prices by 52%.
In Sydney and Melbourne, house prices have increased even more, at 153% and 107% respectively.
That’s a significant jump and a level of price escalation that wages growth is struggling to keep up with.
Domain’s latest First Home Buyers report looks at the rocketing price growth we’ve seen around the country and the implications that the strong market is having on mortgage repayments.
Wages growth vs property price growth
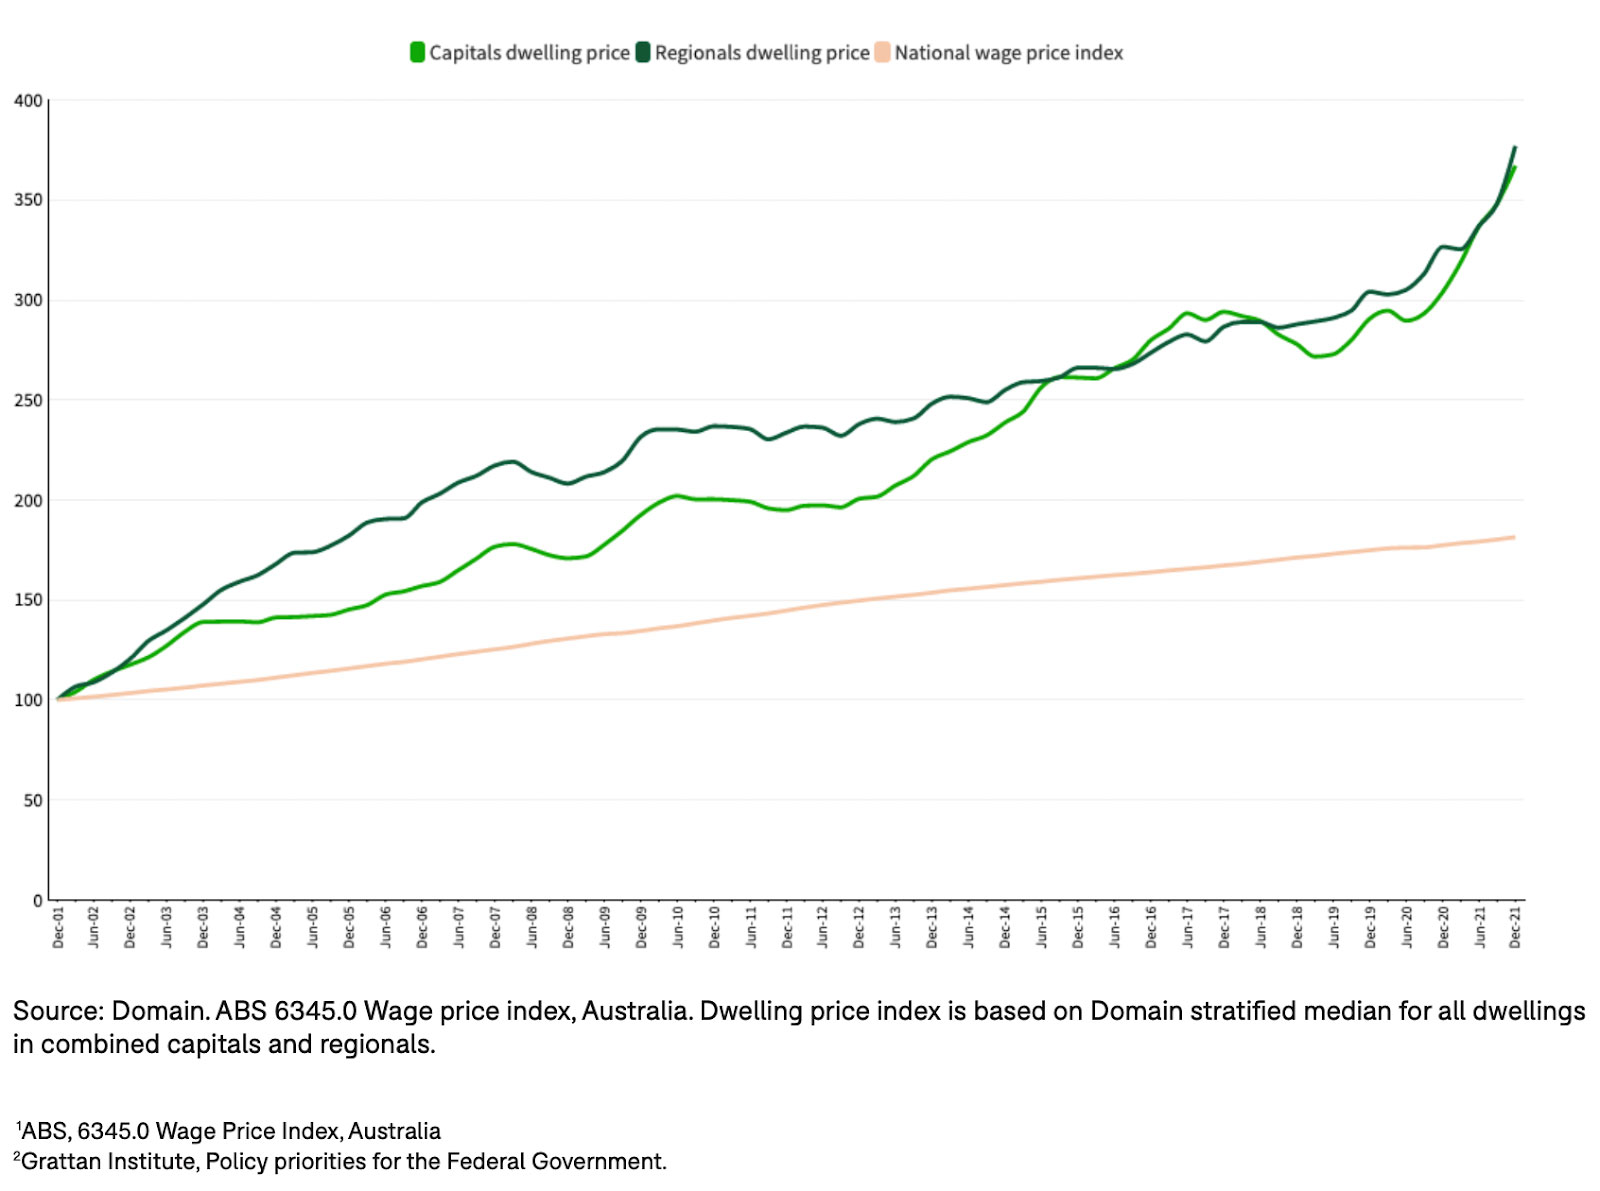
Over the past 20 years, the average annualised growth in capital city dwelling prices is 6.9% and for regionals 7.1%, whereas annualised wage price growth is less than half at 3%, the report explains.
And this is even more exaggerated when comparing an average property price with an average household income.
The graph below clearly shows that while the national wage price index has slowly and steadily risen, dwelling prices in both our capitals and regional areas have risen more steeply, before sharply increasing in the past 2 years.
And it is for this reason that housing costs as a share of income are higher in Australia than in most comparable countries.
Index of growth in Australian dwellings versus wage price index
Mortgage serviceability deteriorates
But property prices and wages growth aren’t the only way to look at housing affordability, the serviceability of mortgages is also a great indicator of the health of the market.
“Low home loan rates have been a key driver of price growth across Australia,” Domain’s report notes.
“This is a double-edged sword driving prices upwards but at the same time improving the costs of a home loan through lower interest rates, as such it is an important element of affordability.”
 Domain calculates mortgage serviceability for a hypothetical first home buyer as the initial mortgage repayments on an entry priced property (a house or unit at the 25th price percentile) for a buyer with a 20% deposit and expressed as a percentage of household income for a couple aged between 25 and 34.
It is generally recommended that homeowners dedicate no more than 30% of their income towards mortgage repayments to avoid ‘mortgage stress’.
And with the exception of entry-level houses in Sydney and Canberra, most capital cities and all regional areas currently sit below this threshold.
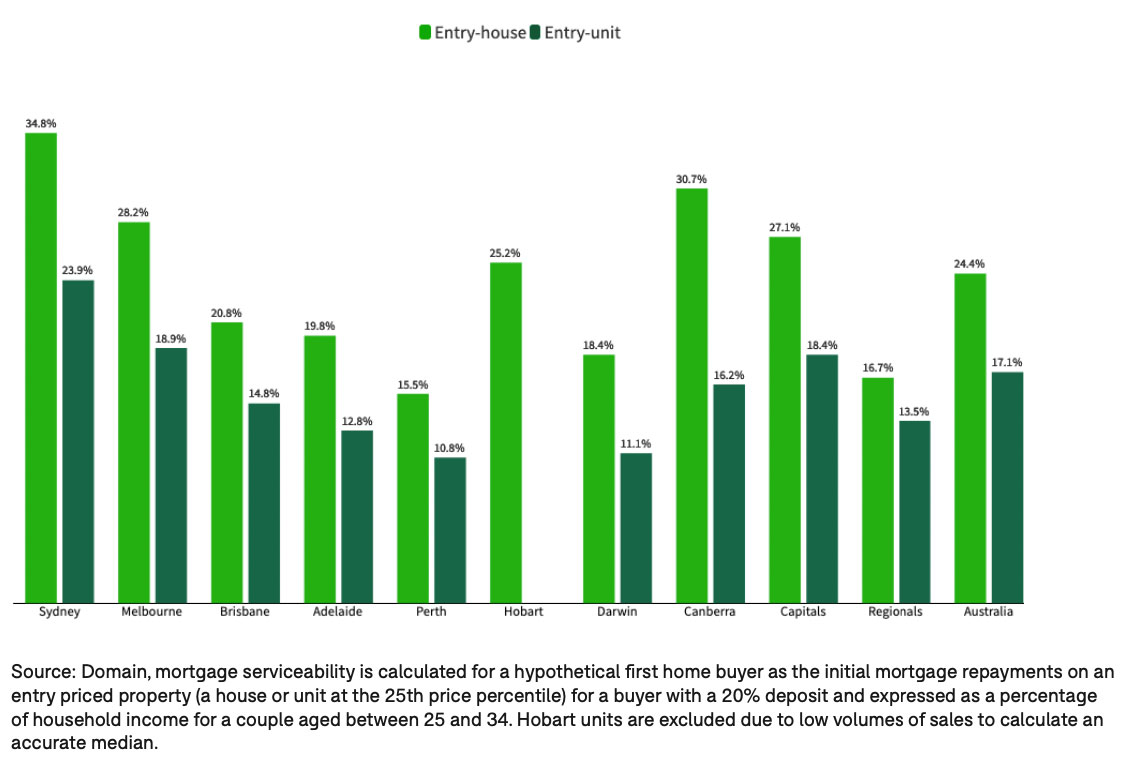
The data shows that on average across the cities, the amount of income required to service a mortgage repayment has increased from 24.9% in 2016 to 27.1%, for an entry-house.
For units, across the capitals, this has dropped from 20.8% to 18.4%.

In regional Australia, for a house, this has increased from 15.2% in 2016 to 16.7%, while for units it has edged marginally higher from 13.4% to 13.5%.
“This unanimously showcases that mortgage repayments as a portion of income are much steadier for units, but getting harder for houses,” Domain says.
By city, first home buyers wanting to buy a house in Sydney or Canberra will face the largest dent in their wages.
Sydney houses account for 34.8% of an owner’s income, while in Canberra the data is an equally high 30.7%.
Remember 30% or above is categorised as ‘mortgage stress’.
Meanwhile, on the other end of the scale, buyers in Perth, Darwin, and Adelaide spend less than one-fifth of their income on mortgage repayments, with Brisbane close behind at 20.8%.
Mortgage repayments on an entry-priced home as a percentage of income for a couple aged 25-34
As you’d expect, the data is less daunting for units.
The report shows that on average, 18.4% of income is dedicated to mortgage repayments across the capitals compared to 27.1% for a house.
By city, Perth, Darwin, and Adelaide again trump the rest of the capitals offering greater mortgage affordability, at 10.8%, 11.1%, and 12.8% respectively.
And Sydney tops the list for the highest proportion of income again, at almost 23.9%, followed by Melbourne at 18.9%.
Costs will creep higher still
 Lower mortgage rates have been a significant driver of the property increase in prices seen over the past couple of years.
But the likelihood of a cash rate increase in 2022 has increased significantly.
Since the onset of the pandemic, the RBA has provided significant economic stimulus and support and has repeatedly stated that they don’t expect conditions for a rate increase will be met until 2024.
And the banks suggest that property owners could face higher mortgage repayments as early as June as financial markets and economists warn a rapid run-up in inflation could force the Reserve Bank to lift official rates above 2% within the next 12 months.
 Combined with growing concern about the upcoming federal election and rising cost-of-living, CBA said it believed the Reserve Bank would have to start increasing interest rates by the middle of the year.
And such a hike is worrying news for homeowners and investors because even a 1% rise could add hundreds of dollars a month in repayments on the average new mortgage.
As Domain’s report points out, mortgage repayments will become a greater proportion of income as interest rates hike.
“As the cost of servicing a home loan is beginning to creep higher, it will slice a larger portion of income as mortgage rates increase, this could be offset as the property cycle moves into its next stage with the potential for some cities to see prices fall, this is already occurring in some premium areas in Sydney,” the report states.
ALSO READ: A long term outlook on housing affordability
[ad_2]
Source link