[ad_1]
Residential real estate, inflation and interest rates just can’t stay out of the news can they?
The latest CoreLogic Chart Pack provides a detailed overview of key market metrics, so here’s what happened in May.
Market overview
The combined value of residential real estate was valued at $9.97 trillion at the end of May, just under the $10 trillion mark.
However, the overall loan to value ratio of Australia’s real estate is very healthy with only $2.1 trillion worth of outstanding mortgage debt.
With half of Australia’s home owners having no mortgage debt and 40% of those with loans having fixed rate loans, and many borrowers well ahead with their repayments, this means most homeowners won’t be affected by rising interest rates for quite some time.

Dwelling values in Australia are 14.1% higher over the past 12 months.
This is down from a cyclical peak growth of 22.4% in the 12 months to January 2022.

Brisbane has the strongest growth.
The highest annual growth rate in dwelling values among the regional and capital city dwelling markets was across Brisbane, at 27.8%.
The lowest rate of appreciation in values was across Regional NT, which each saw a 4.9% rise over the year.


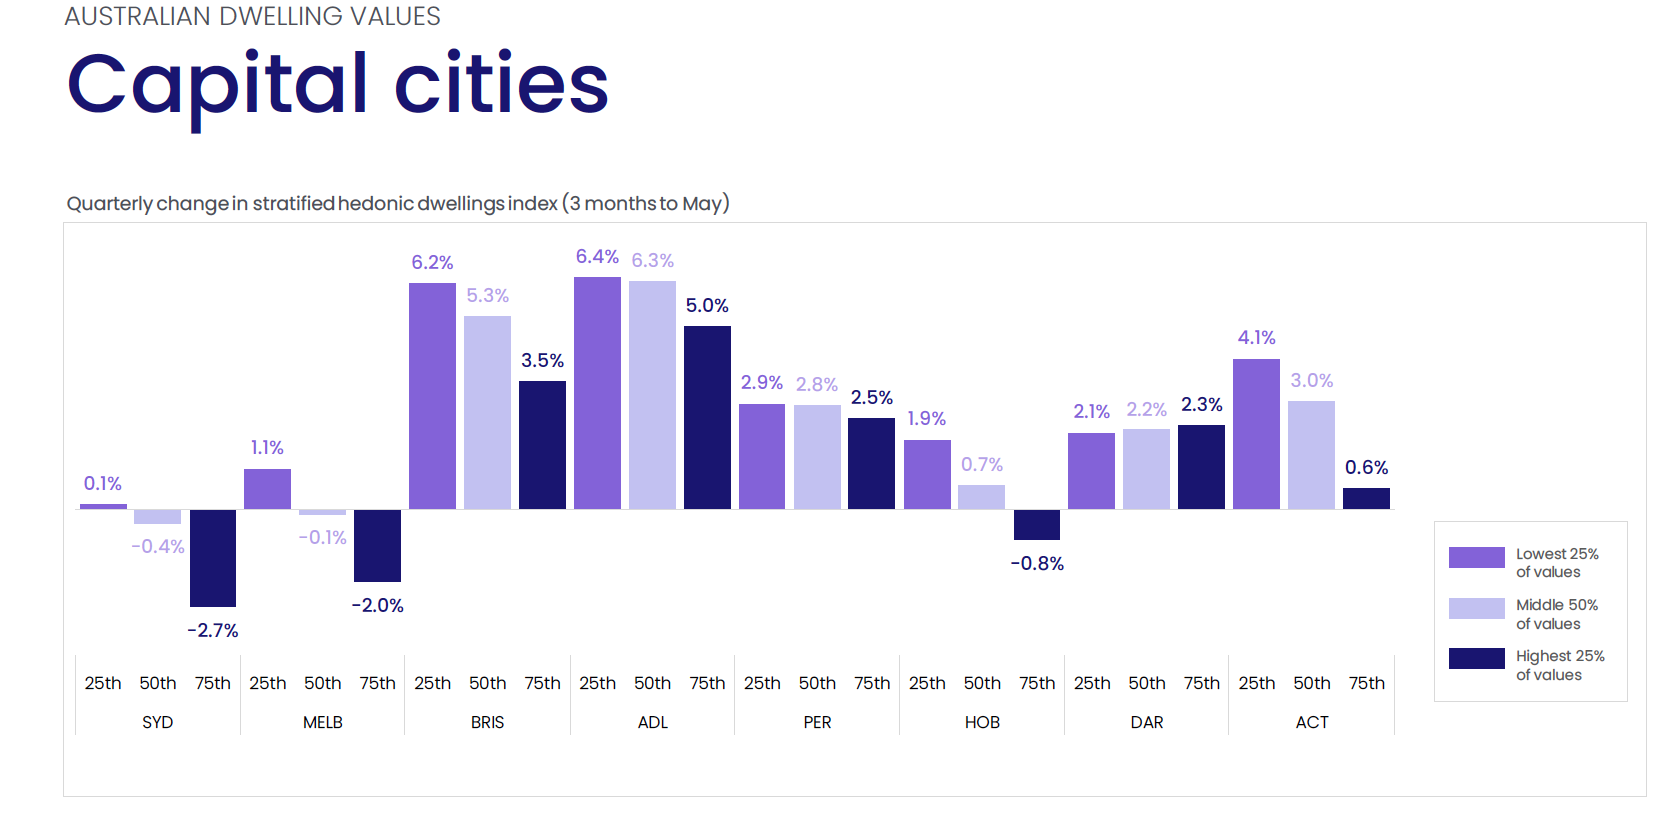
The most expensive properties are suffering most.
In the three months to May, capital city homes saw upper quartile values fall -1.4%, compared to a rise of 3.4% across the lowest quartile of values.
 Sales volumes are starting to ease from recent highs.
CoreLogic estimates that in the 12 months to May, there were 586,602 sales nationally, up 6.5% compared to the previous year.
However, initial sales estimates over May were -26.9% lower than the same month of the previous year.
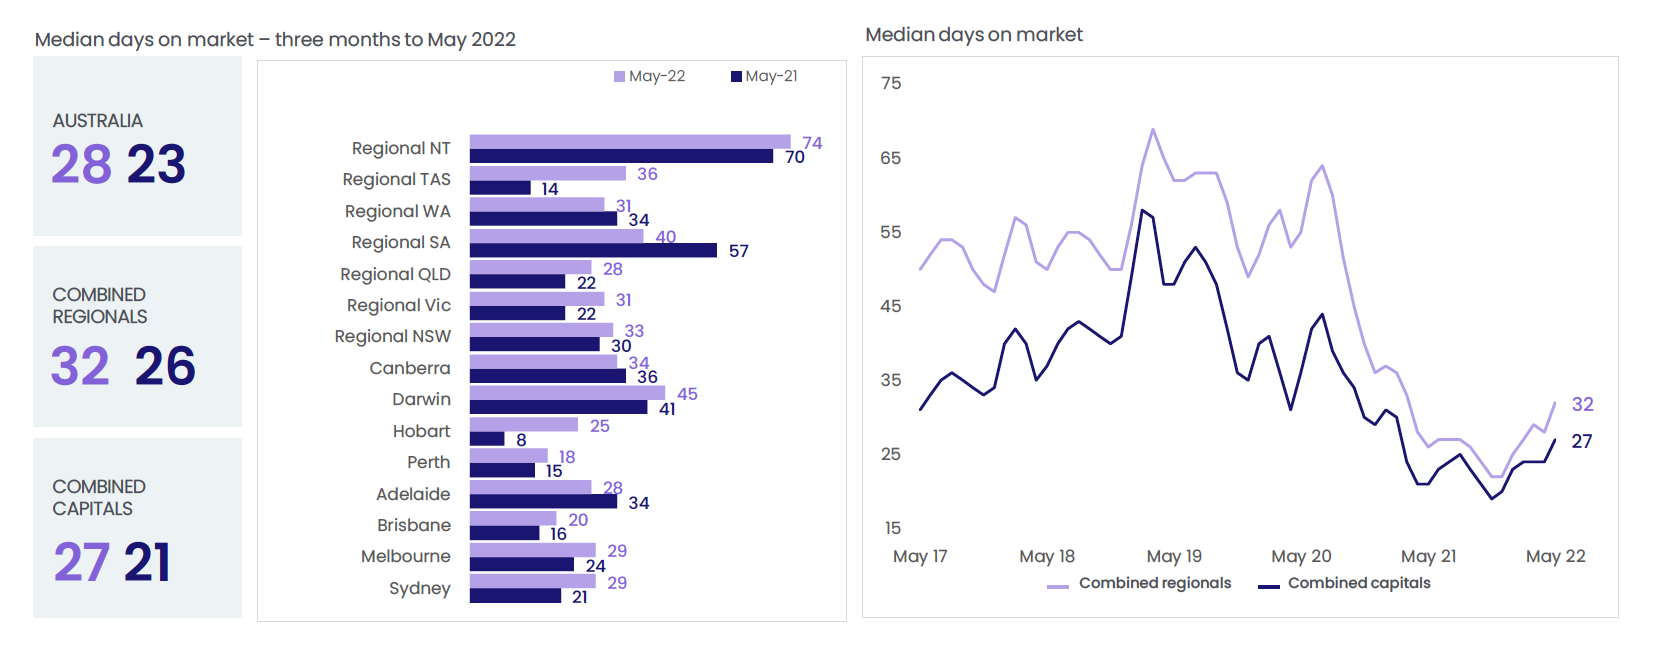
At the national level, properties are taking longer to sell.
In the three months to May, the median days on market was recorded at 28, up from a recent low of 20 days in the three months to November.
Vendor Discounting Increasing
Similarly, vendor discounting has also increased from the recent low of 2.9% recorded in the three months to November last year.
In the three months to May, the median vendor discount at the national level was 3.3%.
In the four weeks to June 6, there were 39,858 dwellings listed for sale nationally.
While new listings volumes have steadied, they are higher than the five-year average for the equivalent period.

Auction clearance rates are softening
The combined capital cities clearance rate continued to trend lower through May, averaging 60.6% in the four weeks to May 29th.
This is down from 75.8% in the equivalent period of 2021.
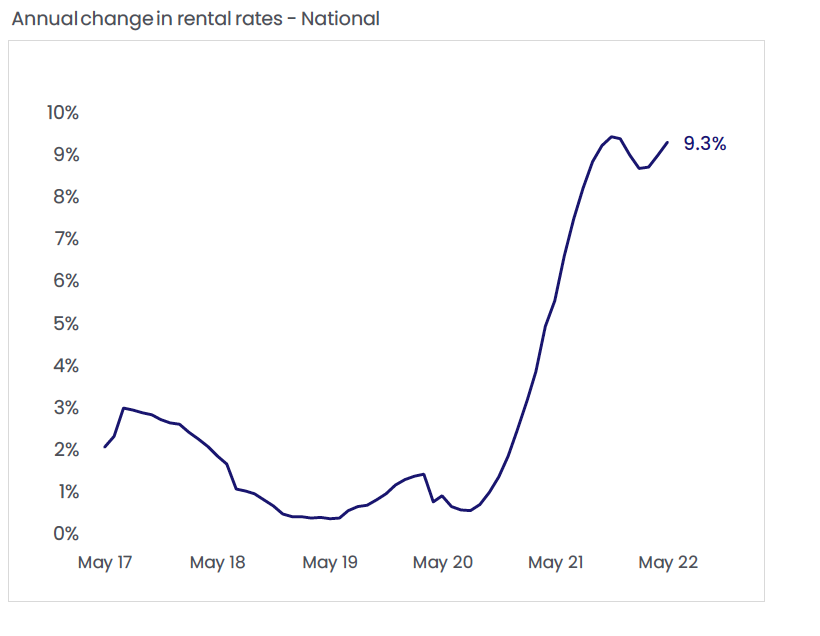
Rents are rising
Unlike changes in dwelling purchase values, rental value growth remains high across Australian dwellings.
Rent values increased a further 1.0% in May, taking rents 9.3% higher over the year.
Through May, Australian gross rent yields rose to 3.3%, up from a recent low of 3.21% through January this year. Since the end of 2021, gross rent yields in Sydney have lifted 17 basis points, and 12 basis points in Melbourne.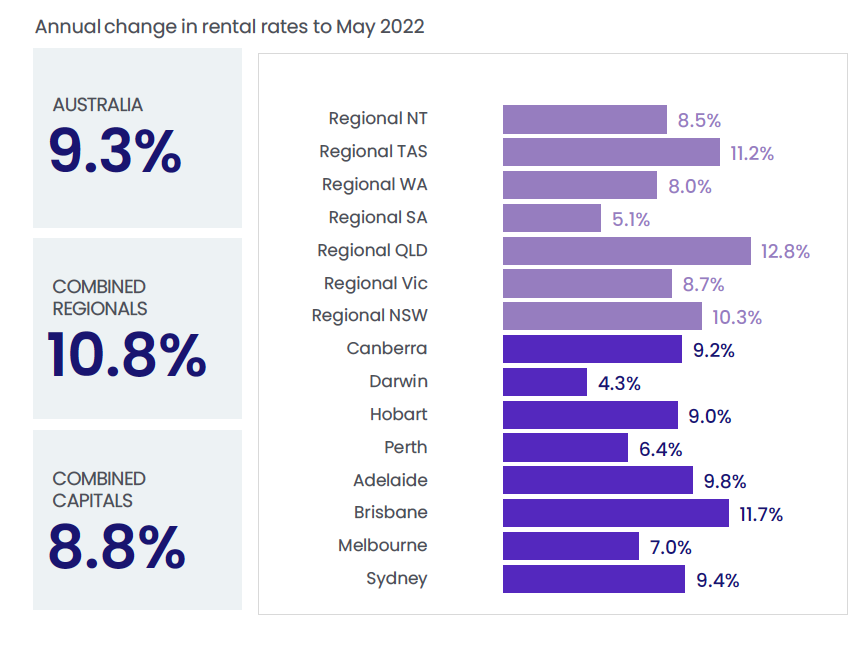
 Dwelling approvals falling
Through April, dwelling approvals declined for a second consecutive month, down -2.4%.
The decline was driven by a -7.9% drop in unit approvals.
With very few new apartments in the pipeline, and many apartment blocks on the drawing board not proceeding because of rising costs and supply shortages, the rental crisis we are experiencing will only get worse
However, detached house approvals were 10,154 through April, remaining above the decade average of 9,777.

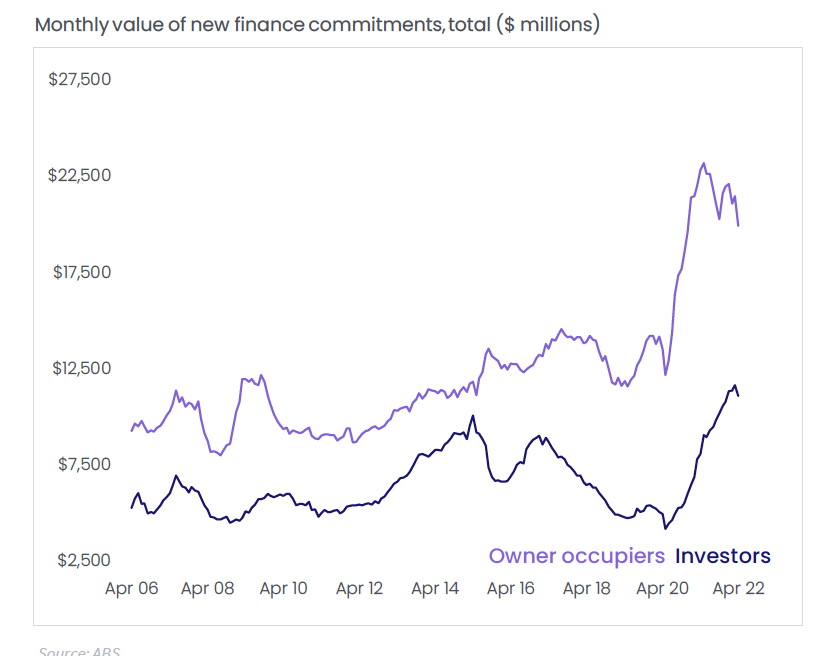
Lending for property purchases fell -6.4% in over the month of April.
Owner occupier lending fell -7.4% (or $1.6 billion), while investor lending was down -4.8% ($557 million).

[ad_2]
Source link