[ad_1]
After recording an easing in the growth trend since March 2021 (2.8%), CoreLogic’s national home index recorded its first month of negative dwelling value growth in 20 months, falling -0.1% across both property types.
This fall in values came amid lower consumer sentiment, increasing global uncertainty, mounting inflationary pressure, and the first cash rate rise since November 2010, up 25 basis points in May.

At one decimal place both houses and units recorded a -0.1% fall in values over May, however taking the result to two decimal places, house values saw a larger monthly decline compared to units, falling – 0.15% and -0.08% respectively.
This saw the quarterly and annual trends in house and unit values continue to weaken, to 1.3% for houses and 0.5% for units over the three months to May, and to 15.6% and 8.7% over the past year respectively.
May’s result saw the annual performance gap between national houses and units fall to its lowest level since April 2021 (6.2%), at just 7.0 percentage points.

The combined capitals unit market fell -0.2%, its first monthly decline in values since October 2020, while regional unit values showed some resilience rising 0.8% over the month.
Monthly declines across Sydney (-0.7%) and Melbourne unit values (-0.3%) weighed heavily on the combined capitals and national results, collectively making up 71.4% and 55.8% of unit markets respectively.
Since peaking in November 2021, Sydney unit values have recorded progressively larger monthly declines, while Melbourne units depreciated -0.1% over the year to date.
While last month’s rate rise likely added further downward pressure to the Sydney and Melbourne unit markets, growth conditions have been weakening over the past year amid worsening affordability, lower consumer sentiment, and rising fixed mortgage rates.

More recently we have also seen surging inflation and a more cautious lending environment also dampening housing demand.
Some of the smaller unit markets also saw values fall in May.
Values across Darwin, Regional Victoria and Regional WA fell -0.2%, -0.4% and – 0.5% over May respectively.
Outside of these markets, growth in unit values remained positive, however, previously strong markets are now showing signs of a slowdown.

Across Queensland, the pace of quarterly value growth has eased from its recent cyclical peak recorded over the three months to April, down 30 basis points in Brisbane (4.3%) and down 1.2 percentage points across regional Queensland (5.1%).
Despite recording positive monthly growth in May, the quarterly growth trend eased further across Canberra, regional NSW, and regional SA.
Adelaide is the exception to the slowdown in growth, with unit values rising 1.2% over May and recording a new cyclical peak in quarterly growth over the three months to May (4.5%).
At the other end of the spectrum, some unit markets, including Hobart (2.0%) and Regional Tasmania (5.4%), which recorded a slowdown in growth over the second half of last year are now seeing their quarterly trend re-accelerate.
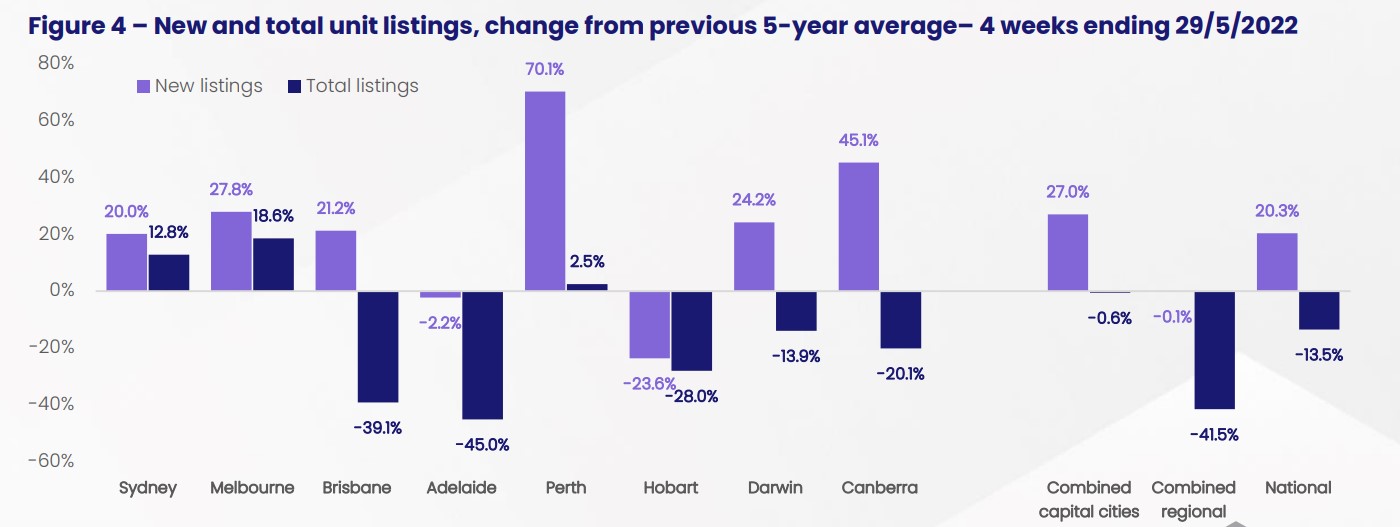
Across the combined capitals, newly advertised unit listings have trended above average throughout the first half of the year, resulting in total listing levels rising from -5.5% below the 5-year average over the 4 weeks to 23rd January to -0.6% below the average over the 4 weeks to 29th May.
While Advertised supply levels have normalised across the combined capitals, listings stock remains diverse amongst the individual capitals.
While newly advertised unit listings are now trending above average in Brisbane (21.2%) and have started to normalise across Adelaide (-2.2%), the total advertised stock remains well below the previous 5-year average for these markets (-39.1% and -45.0% respectively).
Strong demand across these markets is seeing new listings being absorbed at a faster pace than they are being added, helping to insulate these markets from tougher selling conditions.
Over the three months to May, Brisbane recorded 1.3 sales for every freshly advertised unit, while Adelaide reported a sales-to-new listing ratio of 1.6.
At the other end of the spectrum, weakening demand across Melbourne and Sydney has seen the total advertised unit supply rise above the levels seen this time last year (1.2% and 7.3% respectively) and above the previous five-year average (18.6% and 12.8% respectively), increasing competition amongst vendors and providing more choice for buyers.

Rising 9.5% over the 12 months to May, national units are now recording the strongest annual rental growth since July 2007, when rental demand was bolstered by strong overseas migration.
Amid growing affordability constraints and the slow return of overseas migration, rental demand has swung towards the higher density sector, with national unit rents rising 3.4% over the three months to May.
This saw the annual trend in unit rents (9.5%) outpace growth in house rents (9.2%) for the first time since June 2018 (when house rents rose 1.4% while unit rents increased by 2.3%).
Rental demand across the unit segment fell dramatically at the beginning of the pandemic as preferences shifted towards the lower-density sector.
Due to its relative affordability, rental demand across the higher-density sector has grown steadily over recent months.
Another factor aiding rental growth is the recent shortage of rental supply.

Nationally, the count of unit rental listings over the four weeks to May 29 was -30.2% below the previous five-year average, tightening from -29.7% below the average over the four weeks to May.
This saw national vacancy rates tighten from 1.52% in April to 1.47% in May.
Across the combined capitals unit market, Perth and Darwin rental growth continued to ease, while the quarterly pace of growth rose across Sydney (3.4%), Melbourne (3.7%), and Brisbane (3.1%), which had previously seen weaker rental demand at the start of the pandemic.
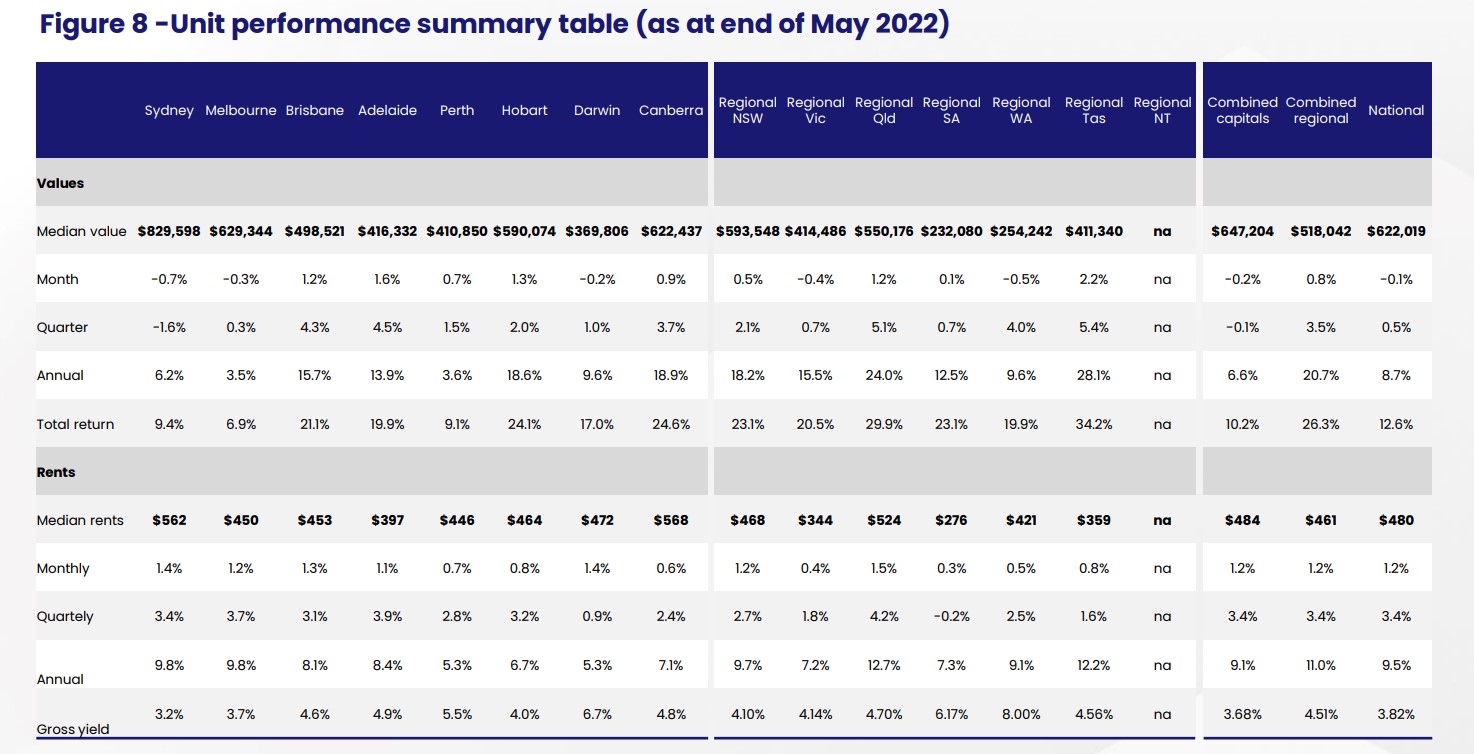
With rental growth now outpacing capital gains, nation gross unit yields have risen 16 basis points from a recent low of 3.66% in December to 3.82% in May.
Changes in yields are more diverse across the capitals, falling 5 basis points in Adelaide (to 4.90%) and holding steady across Brisbane (4.63%).
Unit yields across Sydney (3.23%), Melbourne (3.66%) and Perth (5.54%) are up compared to this time last year, albeit from a low base.

Given the RBA announced a further 50 basis point rise to the cash rate at the June 7 meeting, unit values are likely to continue to trend downward throughout the remainder of the year.
However, the peak to tough decline in unit values should be less severe compared to the detached houses sector, with the higher density segment historically being less volatile than houses.
Moving forward, a number of factors should help offset some of the downside risks affecting the broader housing market.
The relative affordability across the unit sector, both in values and rents, will likely be increasingly desirable amid a period of high nondiscretionary inflation and increasing interest rates.
Additionally, surging unit rents should help to support investor demand, partially as gross rental yields rise.
As the higher-density market shifts into the downward phase of the cycle, it’s important to remember that the current downturn comes after some of the strongest growth in unit values in 20 years.
Since October 2020, national unit values have increased by 16.1%, equivalent to an $86,028 rise in median values.
While further declines will likely eat into this growth, these capital gains, coupled with the higher repayment buffers accumulated over the pandemic, should help insulate the markets from distressed sales.
[ad_2]
Source link