[ad_1]
National unit values fell for the second consecutive month in June, as rising interest rates put further downward pressure on the country’s two biggest cities, Sydney and Melbourne.
CoreLogic’s Home Value Index recorded a -0.4% decline in national units in June, taking values -0.2% lower over the quarter.
Australia’s medium and high-density markets have been slightly more resilient compared to detached houses, which saw values fall -by 0.7% over the month.
Nationally house values are still outpacing units both quarterly and annually, however, the 12-month performance gap between houses (12.5%) and units (6.8%) has almost halved, reducing to 5.7 percentage points from a 10.9 percentage point gap in September 2021.

Affordability continues to be a driving force for declines in unit values.
While capital city unit values fell -0.5% in June and -0.7% over the past three months, this was predominantly caused by declines across the capitals’ most expensive markets, with upper quartile unit values decreasing by -2.2% over the quarter.
The quarterly fall in capital city unit values is being led by declines in the most expensive markets.
Over the June quarter, values for units in the broad middle market remained flat while the lower quartile, the most affordable 25% of the market, increased in value by 2.0%.
This illustrates the diverse growth conditions across the unit sector, even as the pace of growth eases across these value segments.


Sydney’s median unit value ($821,150) has recorded the strongest decline, falling -1.0% in June and -2.1% over the past three months.
After five consecutive months of falling values, Sydney units are now just 3.5% higher than they were this time last year, and -2.9% below the peak value recorded in November 2021.
Across Melbourne, unit values fell -0.6% in June and -0.5% over the quarter, while Hobart, which has the smallest relative gap between house and unit values, saw values declined -by 0.3% over the month.
The number of listings in Sydney and Melbourne also normalised throughout 2022, helping to dampen demand.
At the end of June, total advertised unit listings were 15.4% above the previous five-year average in Sydney, and 20.3% higher than Melbourne’s five-year average.
More choice has helped rebalance buyers’ power at the negotiating table and has taken some of the urgency out of the market that was seen at the beginning of 2021.
Adelaide’s unit market is the only capital city or rest of the state house or unit market yet to show signs of a slowdown in growth, recording a new peak monthly rate of 1.7%.
The quarterly rate of growth also hit a new peak of 4.9% in June.
Adelaide is the outlier in terms of unit performance at present, partially due to an extraordinary shortage in stock.
With approximately 1,100 units advertised for sale at the end of June, Adelaide’s total listing levels are -35.0% below the level seen this time last year and -45.9% below the previous five-year average.
While value changes remain positive across the remaining capital cities, the difference is the pace of growth has come down significantly between the first two quarters of 2022.
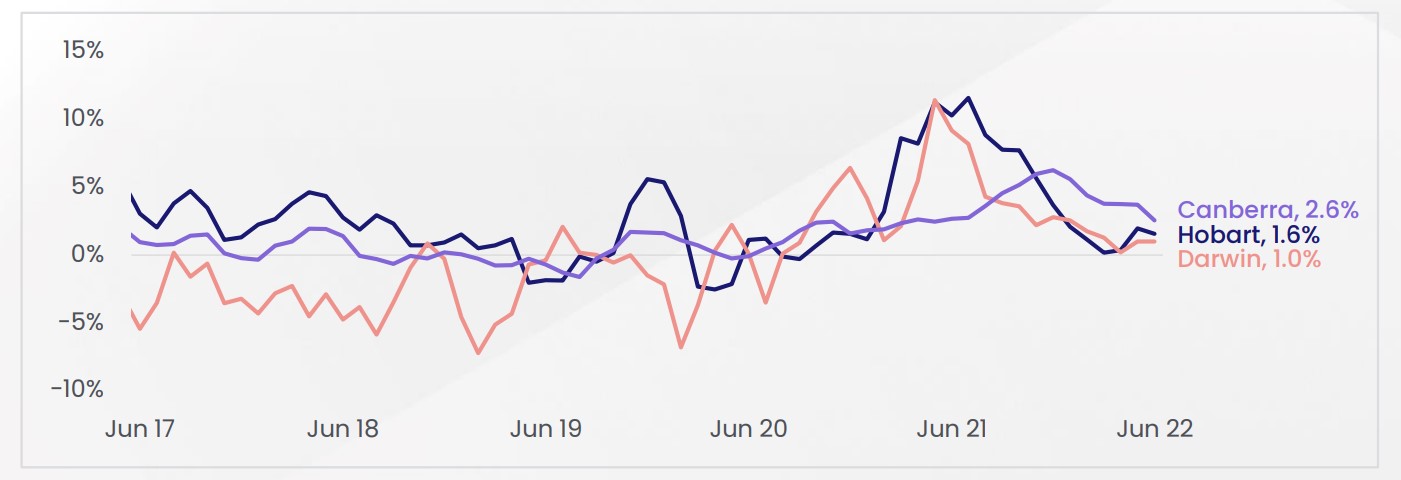
Brisbane’s quarterly growth has eased from 4.6% over the three months to April, to 3.5% over the June quarter and similar easing has been seen across Canberra, Perth, and Darwin, recording quarterly increases of 2.6%, 1.1%, and 1.0% respectively.
Recent CoreLogic analysis found 68.2% and 59.4% of Sydney and Melbourne house and unit markets recorded a quarterly fall in unit values, while only 5.6% and 5.0% of suburbs in Brisbane and Adelaide saw unit values fall over the quarter.

Regional unit values have been somewhat more resilient than capital cities, rising 0.2% in June and 2.0% over the quarter.
Despite regional units recording significantly stronger annual growth compared to combined capitals – 18.5% compared to 4.7% – regional units are still relatively affordable.
At approximately $520,000, the combined regional median unit value is about $125,000 cheaper than the combined capital’s median value.
Across the individual rest of state markets, results have been more varied over the quarter, with unit values falling across regional Victoria (-0.7%) and regional SA (-0.3%), but rising across regional NSW (0.7%), regional QLD (3.4%), regional WA (1.3%) and regional Tasmania (4.5%).
Similar to the capitals, the pace of growth has started to slow across the regional markets, with regional NSW (-0.1%) and regional WA (-0.2%) seeing values decline in June.


While unit values are shifting into the downward phase of the cycle, unit rents are surging, with most of the capitals and rest of the state regions recording their highest unit rental values on record.
Rising 1.1% in June, national unit rents recorded the strongest quarterly growth (3.5%) since May 2008 and the highest annual trend since CoreLogic records commenced, breaking into double digits for the first time (10.0%).
Annual growth in unit rental values is now outpacing house rents across both the combined capitals (9.8% and 8.8% respectively) and combined regional markets (11.0% and 10.7% respectively), as growing affordability constraints force more tenants towards medium-to-high density living.
Rising rentals
The current upswing in rental demand has occurred largely in the absence of overseas migration and instead has been fuelled by a decline in the average household size.
As house rents, which saw stronger growth at the beginning of the pandemic, become more unaffordable, some renters are likely to have little choice but to shift their preferences to the relatively more affordable medium-to-high density sector instead.
Adelaide, which is the most affordable capital to rent a unit in ($405 per week), recorded the strongest quarterly growth in rental values (3.9%), followed by Sydney and Melbourne, which both saw unit rents increase by 3.7%.
Rental growth was weakest across Canberra (1.9%) and Darwin (2.4%), while unit rents rose by 2.5%, 2.8%, and 3.5% in Perth, Hobart, and Brisbane over the past three months.
Rental growth continues to be supported by record low vacancy rates, with just 1.42% of national unit rentals observed as vacant over the month.
As overseas migration returns to pre-COVID levels, its likely rental demands will stay strong for some time yet, putting further pressure on vacancy rates.
National gross unit yields expanded further in June, rising six basis points to 3.88%, as rental growth continues to outpace capital gains.
Compared to this time last year, unit yields are up 26 basis points across Melbourne (3.73%), and up 16 and 15 basis points across Sydney (3.31%) and Perth (5.53%) respectively.


What’s ahead?
The outlook for units is much the same as houses, continuing to skew toward the negative with interest rate rises, inflation, and global uncertainty weighing heavily on consumer sentiment.
As the market shifts further into the downwards phase of the cycle, the declines recorded across the upper quartile unit markets are likely to become more broad-based and widespread.
While the market is likely facing a correction there are a number of factors that should help offset suggestions of a market crash.
Strong labour markets, high borrower repayment buffers, and serviceability assessments undertaken at the time of the loan origination should help minimise the number of distressed listings hitting the market.
Additionally, given units are relatively more affordable than houses and the recent sustained strong rental demand, buyer demand amongst owner-occupiers and investors should be somewhat insulated from the worst of the market’s downturn.

[ad_2]
Source link